Explanation of the Greeks Report
using CME Bitcoin (BTC) options
The Greeks Report is composed of several sections. We will quickly review what they are and how they might be interpreted. The report is composed of a title page plus a collection of plots of the total greeks at a strike or versus a (call) delta. There is a great deal of similarity in that the same set of plots are repeated for each greek and for both the strike based and delta based view. Finally, each report is capped with some notes and our disclaimer.
The Title Page
The title page has very basic description presented. It lays out the products which were used in the creation of the report. The user is specified. Additionally, details about model and calendar choices are also spelled out.
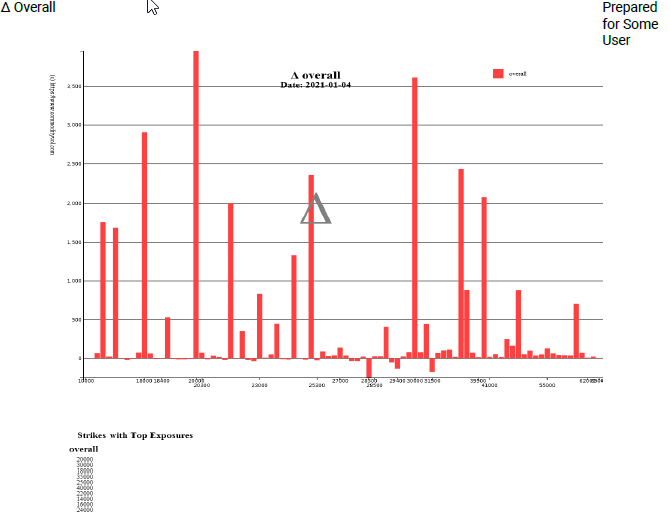
[Δ, Γ, ν] Overall [$ strike, Δ]
This page takes all of the expiries present and sums up the greek per strike or per delta. There is no adjustment for time to expiry nor anything else. Additionally, there is a table which lists the overall largest delta strikes. Additionally, note that the x-axis has two sets of labels. The top set is a union of all "interesting" strikes. The bottom set is an evenly spaced out grid which drops the label if it coincides with the interesting set. This manner of exposition was chosen to help minimize the confusion from products with many strikes.
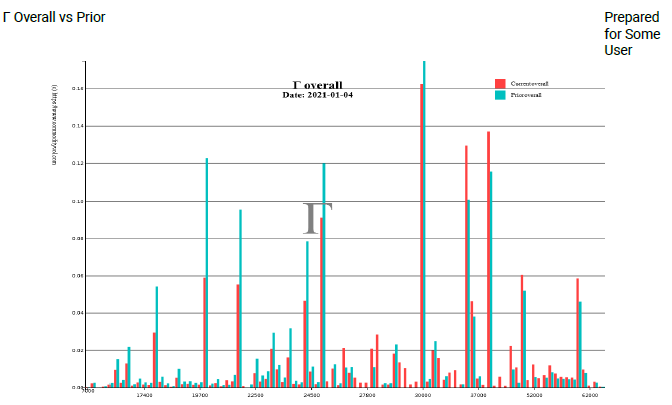
[Δ, Γ, ν] Overall vs Prior [$ strike, Δ]
This page takes all of the expiries present and sums up the greek per strike or per delta. This is no different than previously. However, the same calculation is provided for a previous period exactly 5 business days prior. The aim of this plot is help diagnose changes in the overall market enviroment. In the plot shown, we see that the $35000 and $40000 strikes are showing increased gamma spikes.
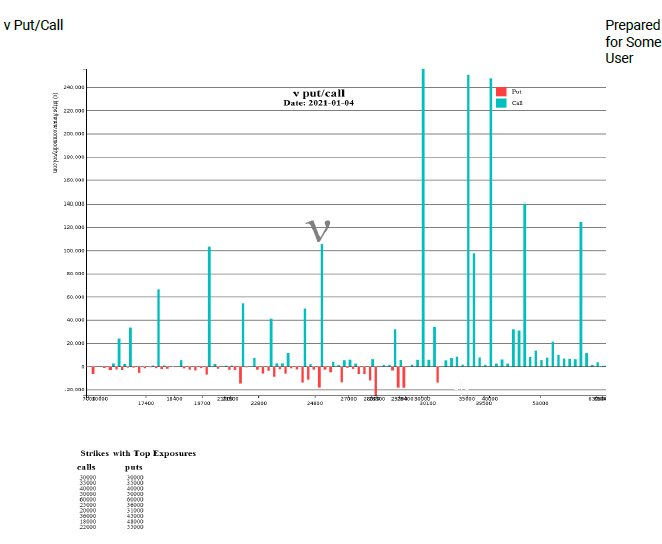
[Δ, Γ, ν] Put/Call [$ strike, Δ]
This view takes the greek position and splits puts versus calls. It mirrors the y-axis for the puts. The mirroring is done in order to aid in comprehension and does not imply a different sign of the put greek versus the call greek.
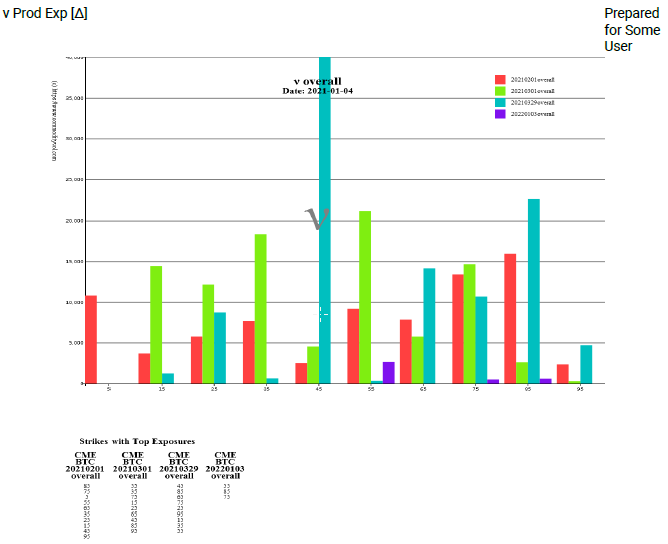
[Δ, Γ, ν] Prod Exp [$ strike, Δ]
This view takes the greek position and splits the total greek by expiry. The color coded bars corresponds to expiry date. In this example, the largest vega postion occurs at the strike corresponding 45 delta.
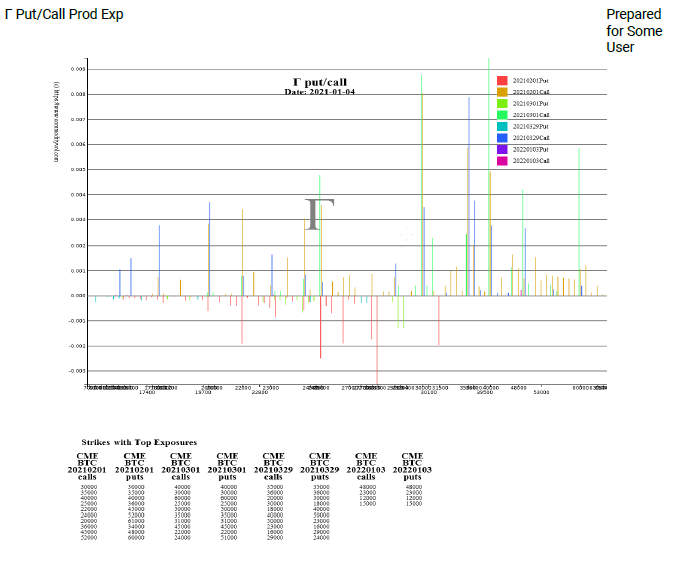
[Δ, Γ, ν] Put/Call Prod Exp [$ strike, Δ]
This view takes the greek position and splits the total greek by expiry plus type. The color coded bars corresponds to expiry date. The puts are shown on a mirrored axis.